
Bootstrapping with StatCrunch
The Bootstrap Method
The bootstrap method is a very useful tool to have an introductory statistics class.
The bootstrap method begins with a sample of size n. Then a large number (I use 10,000 in my classes) of samples of size n are drawn with replacement from that sample. A sample statistic is computed for each sample. A typical use of bootstrapping involves the mean, but this procedure can be applied to the median, quartiles, variance, … Percentiles can be used to generate a confidence interval for a population parameter, or claims about a population parameter can be evaluated.
This web page from Thought.co shows an example of the basic procedure.
Michael Sullivan and I are including bootstrapping in the second edition of Interactive Statistics, and the explanations (and video) will make the method accessible to instructors and students.
This method requires a great deal of computing power, which is well in the grasp of today’s devices.
How I Incorporate Bootstrapping
I use it in two ways in my classes. First, I use it early in the course (week 3) to give my students a preview of what we will be doing in inferential statistics by generating a 95% confidence interval for the population mean age of students at my college. We also use it to bootstrap the population mean difference for a matched pairs study (prices of items at two different stores). Here are copies of the two bootstrapping projects I used this week:
Project 4 bootstrap paired difference
Head on over to my StatBlog to read more about these two projects – look for the Day 11 & Day 12 posts.
A second way I use this method is later in the course when the conditions for a confidence interval or hypothesis test re not met. Since this method does not rely on a distribution, it can be used as a nonparametric procedure when the conditions fail.
StatCrunch
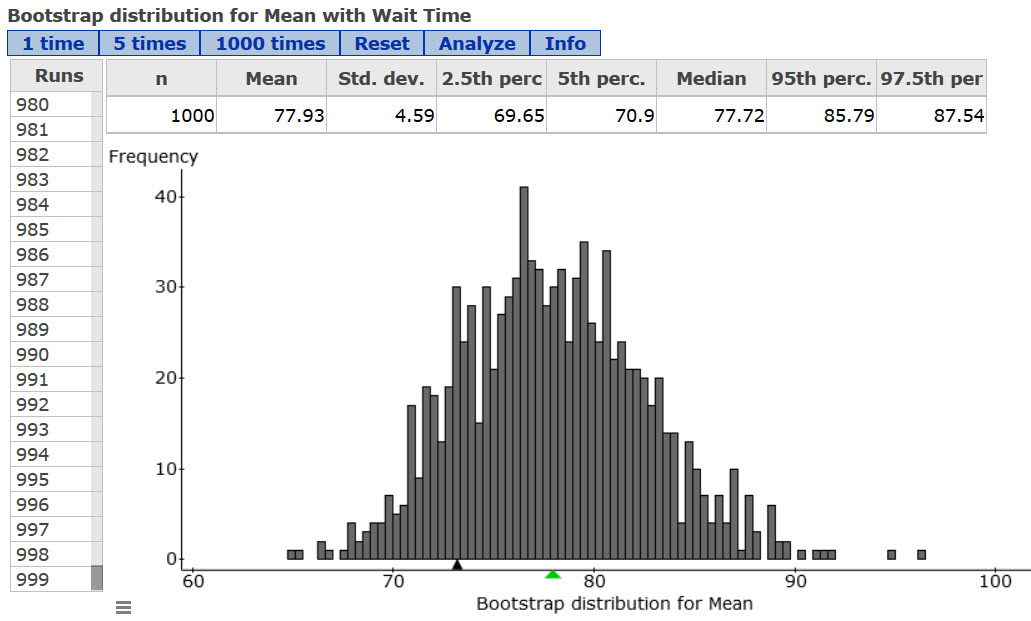
StatCrunch makes using this method easy and painless. For a population mean, enter the sample data in a column. To build the applet, you can find it under Applet > Resampling > Bootstrapping a Statistic. Select the column and click Compute! to build it. Run it a large number of times (we do 10,000 times), and the 95% confidence interval can be determined by looking at the 2.5th percentile and the 97.5th percentile. Here’s some sample output for a population mean:
For the matched pairs example, we found the difference between the two samples of paired data, and used that column for bootstrapping. It is a great chance to talk about what the signs of the endpoints tell you about how the two populations compare to each other.
Summary
I highly recommend working this method into your Intro Stats course, both early in the course and late as well. Do you have any experience that you’d like to share? Questions about bootstrapping? Please leave a comment.
Each Thursday I try to write a technology related blog. If there’s anything you’d like me to discuss, or if you’d like to contribute a guest blog, just let me know. – George