Bootstrap Method – Estimating a Population Mean
Last week we did our third project that focuses on introducing inferential statistics earlier in the semester.
Download the Activity (pdf) Here
The bootstrap method repeatedly samples from a sample (with replacement) to help develop an interval estimate of any population parameter. For example, if there is a sample of 10 numerical values we select 10 values (with replacement) and compute the mean of that sample. We then repeat that process for a total of 1000 samples. We can then use the 2.5th and 97.5th percentiles to bootstrap a 95% confidence interval estimate for the population mean.
Investigation 1
Here’s the first example we walked through together, bootstrapping a 95% interval estimate:
A manager of a fast food restaurant devises a new drive-through system that he believes will decrease wait time from the time an order is placed to the time the order is received. He initiates the new system at his restaurant and measures the wait time for 10 randomly selected orders. The wait times, in seconds, are provided below.
| 108.5 | 67.4 | 58.0 | 75.9 | 65.1 |
| 80.4 | 95.5 | 86.3 | 70.9 | 72.0 |
Use the bootstrap method to create a 95% confidence interval for the mean wait time for the new system.
Here are the StatCrunch results for bootstrapping 1000 samples.
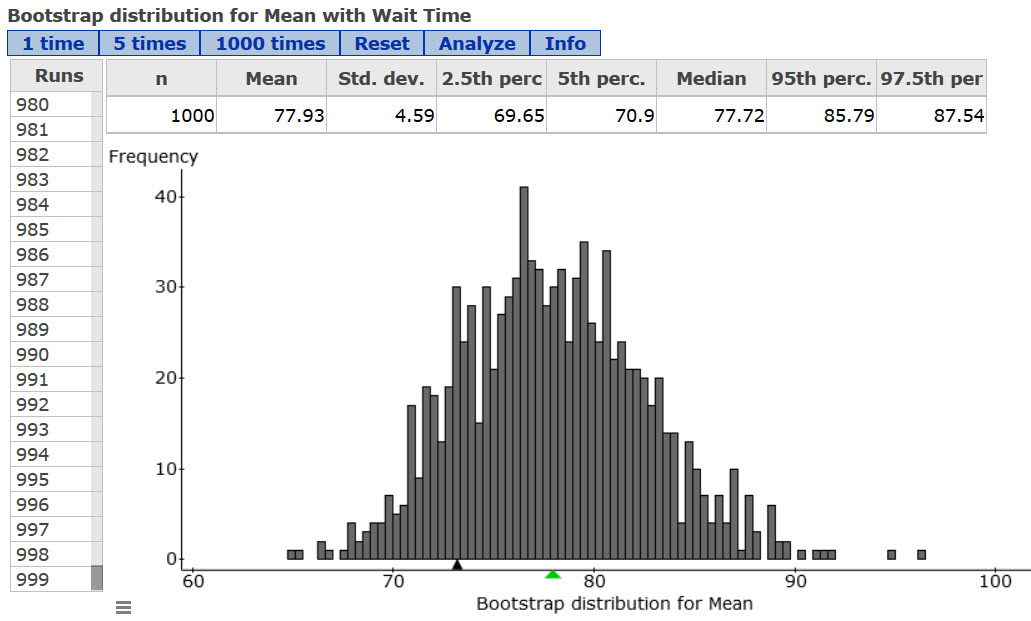 The interval was 69.65, 87.54.
I followed up with an inferential question:
The manufacturer of the system claims that the mean wait time for all customers should be approximately 80 seconds.
Is this value contained inside the 95% interval?
Is the manufacturer’s claim plausible or is it unlikely to be true? Explain your decision.
Investigation 2
I followed up with a second investigation involving the sale prices of beachfront condos, and an inferential question where the claimed population mean fell outside of the interval.
Investigation 3

I sampled the ages of 126 of my students and we applied the bootstrap method to this sample. I first had the students make their own claim about the mean (and median) age of all students at our college, and they then evaluated their claims using the bootstrapped estimation intervals.
I followed up by giving them the true mean and median age from our college’s information office, and both of these values were outside the estimation intervals. We then had a great chance to discuss the ways my sample could be biased and how the conclusions based on intervals from this sample were unreliable.
All in all, it was a great learning experience and I felt we took one giant step towards understanding the big picture in intro statistics.